
A pattern that's repeated many times throughout history.
An institution collects narrow, often defensible data about a real problem. The data enters a public environment that rewards alarm over precision. A policy conclusion follows that the data itself cannot support. Ideologues, elitists and opportunists jump onto the story to push their own agenda, often one of exclusion and resource hoarding.
Brigham, A Study of American Intelligence
Army testing data read as proof of racial hierarchy. Brigham later repudiated his own conclusions. Read more. . .
College Board, On Further Examination
A measured internal study of a real SAT decline, read publicly as national educational collapse. Read more. . .
A Nation at Risk
"A rising tide of mediocrity." Rhetoric outran evidence and reshaped policy for a generation. Read more. . .
No Child Left Behind
Achievement gaps documented by standardized tests became the basis for a national accountability system built on the assumption that testing could accurately measure educational quality and drive improvement. Read more. . .
How Test Optional Policies . . . Harm High Achieving Applicants
An internal Dartmouth working group looks internally at Dartmouth's application of test optional policy, finds it lacking, and claims their bad practices apply to all colleges. Read more. . .
UC's Own Fifty-Year Experiment With the SAT
UC didn't adopt the SAT once and keep it. In 1960 the university began, in its own words, "a series of experiments" with three explicit goals: improve prediction of freshman GPA, assess grade inflation, and manage enrollment growth. Fifty years, at least five major test revisions, and one Regents vote later, UC's own conclusion was that the test succeeded at exactly one of the three. It helped manage enrollment. It never meaningfully improved on GPA at predicting freshman grades, and it never closed the gap it was supposed to help diagnose.
| Period | SAT | ACT | Subject Tests | Primary Use | Why Policy Changed |
|---|---|---|---|---|---|
| 1960–1962 | Required | Not accepted | — | Experimental | Test whether the SAT improved prediction of freshman GPA, measured grade inflation, and helped manage enrollment. |
| 1962–1968 | Limited use | Not accepted | — | Eligibility support | Despite BOARS finding the SAT added "little or nothing" beyond GPA, UC retained testing while reconsidering its role amid enrollment growth. |
| 1968–1978 | Required | Accepted | — | Eligibility | Standardize admissions statewide. Tests primarily determined eligibility for out-of-state applicants and Californians with GPAs between 3.00–3.09. |
| 1979–1998 | Required | Accepted | — | Eligibility Index | Use GPA + test scores to keep UC freshman eligibility near the California Master Plan target of the top one-eighth (12.5%) of high school graduates. |
| 1999–2004 | Required | Accepted | Three required | Selection | Shift emphasis from aptitude to achievement. SAT II Subject Tests become central while Atkinson challenges the SAT I. |
| 2005–2011 | Redesigned SAT + Writing | Accepted | Two required | Selection | Evaluate the redesigned SAT while continuing comprehensive review. |
| 2012–2020 | Required | Accepted | Optional → Eliminated | Holistic Review | Testing becomes one factor among many as UC reevaluates its value. |
| 2020 | Not considered | Not considered | — | None | End the five-decade experiment with standardized admissions testing. |
Sources: John Aubrey Douglass, University of California versus the SAT: A Brief History and Contemporary Critique (CSHE.8.2020); UC Academic Senate records; California Master Plan for Higher Education; Akil Bello, "After 50 Years, The University of California Is Done With the SAT Experiment," Forbes (2021).
How the University of California math crisis was built.
Crisis construction has a playbook. Identify a real change to a "traditional" metric (students aren't learning Greek, using a slide rule, writing in cursive). Find a sample to support it. Argue for tighter gates. Launch it with a title built for hyperbole.
The College Board ran that playbook in 1977, framing its own report as proof public education had failed. A Nation at Risk ran it again in 1983.
UC San Diego is running it now.
In February 2025, UCSD's Math Preparation Workgroup studied a real rise in remedial math enrollment. Their report was careful: the cause was complex, beyond their charge, and beyond a single fix. They declined to recommend admissions changes.
Then the Senate Admissions Working Group got involved. Overlapping data, some overlapping membership. Opposite conclusion: reinstate the SAT. By May 2026, an open letter had stripped away what little caution remained, turning implication into assertion and asking for signatures instead of evidence.
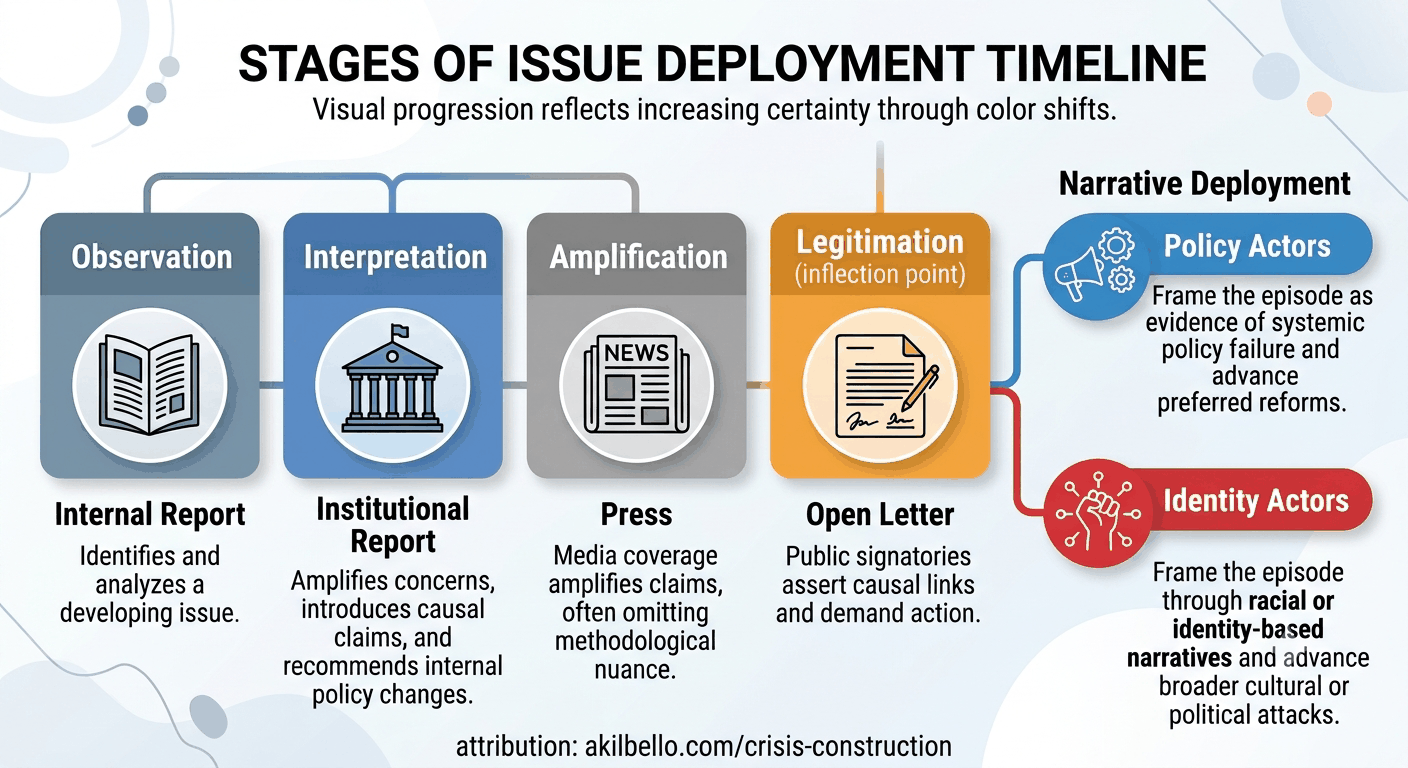
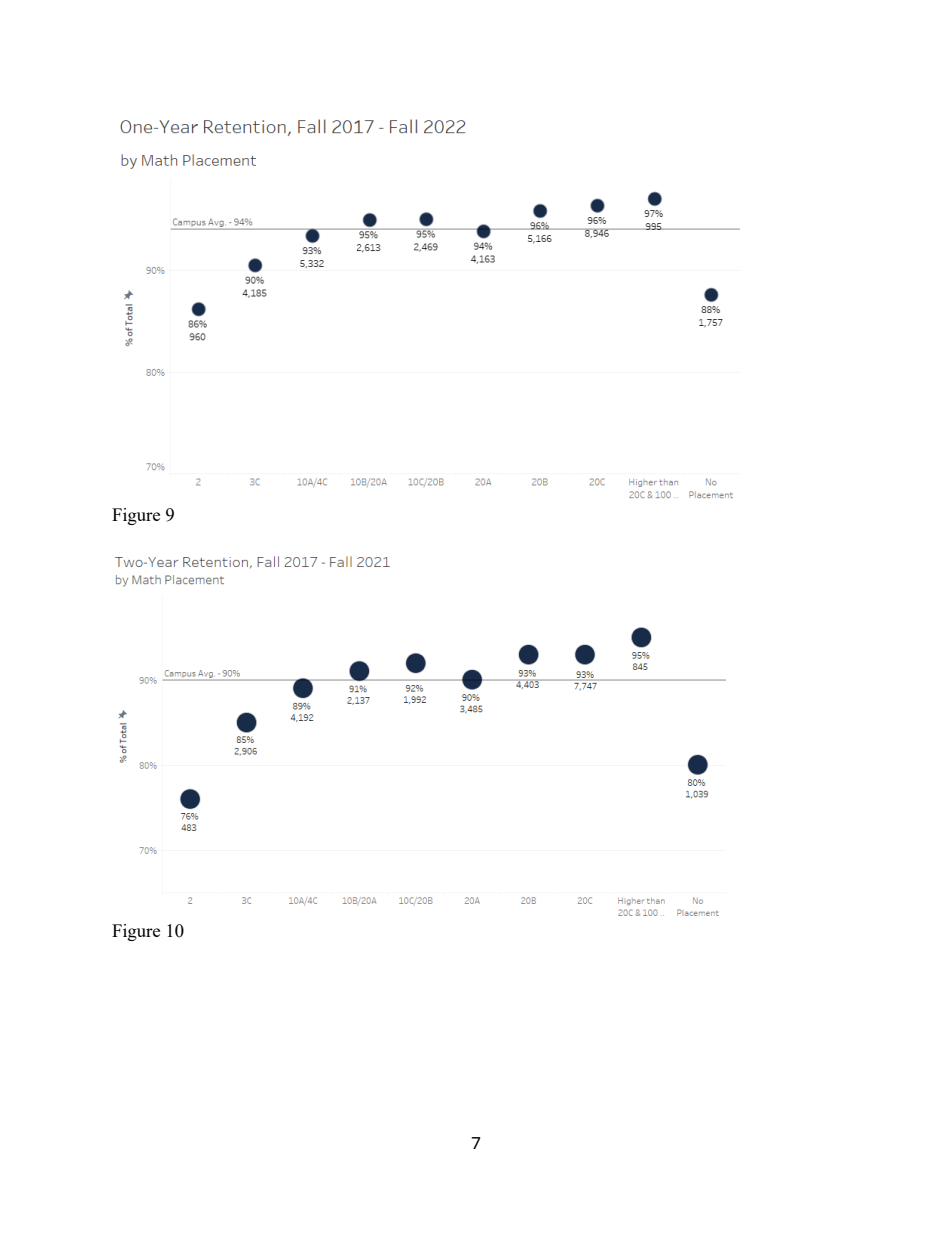
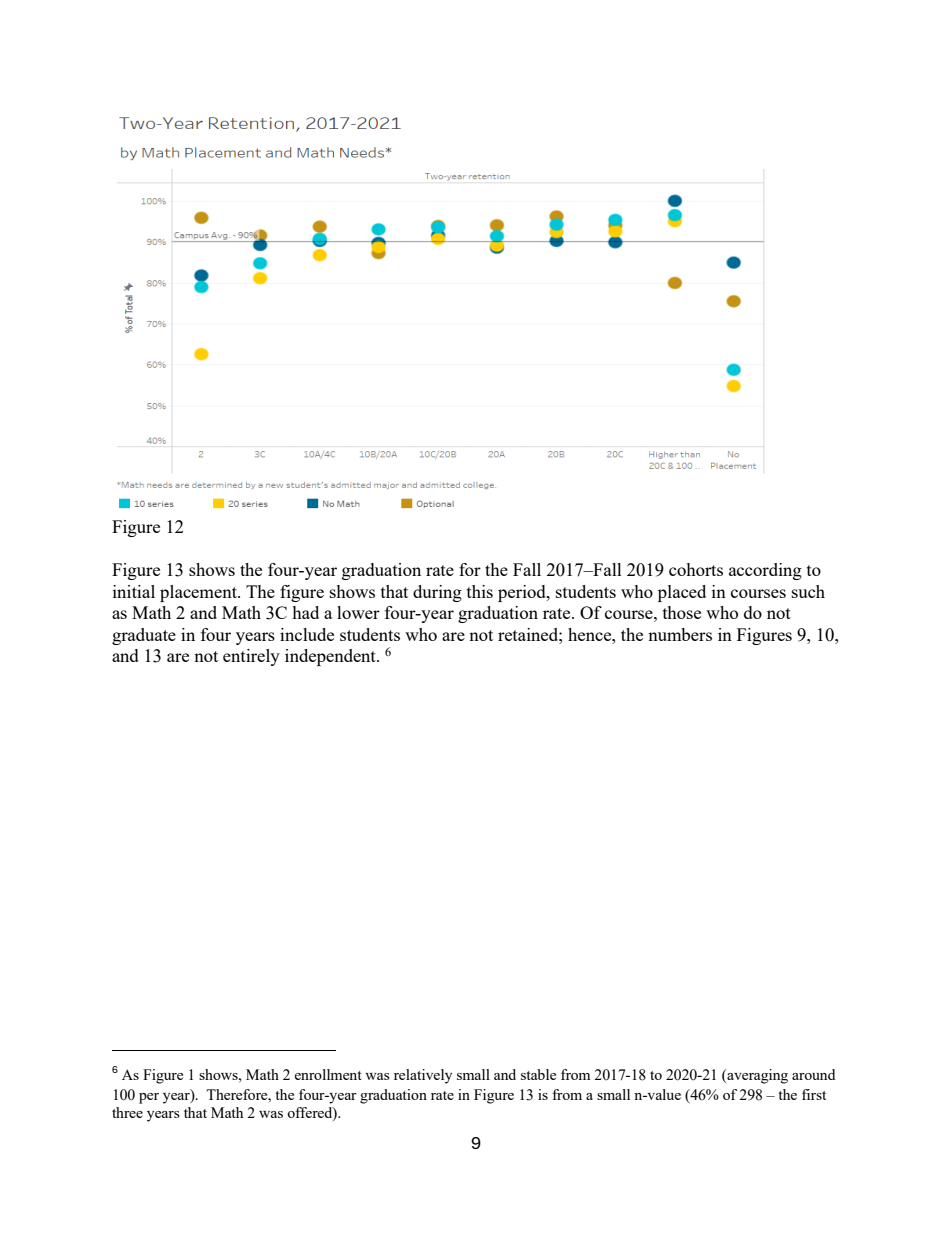
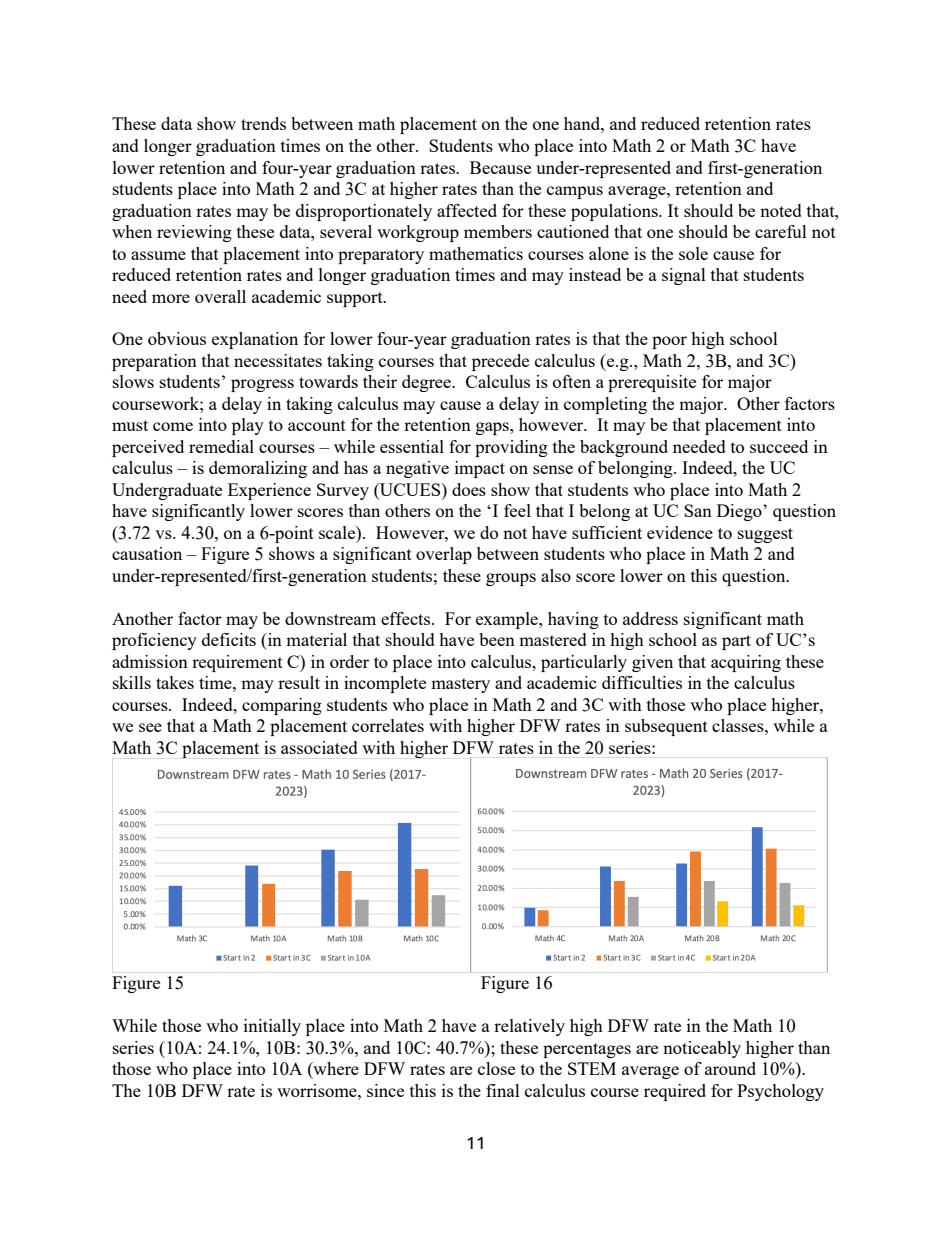
Along the way, the reports quietly redefined their own terms — "remediation" meant something different from year to year, making the trend look steadier than the underlying courses actually were. And the number both reports lean on hardest, LCFF+ enrollment as the driver of the crisis, was falling 18% during the exact years remedial enrollment grew 136%. Their own data contradicts their own headline.
With every escalation, the media found a statistic to hyperbolize. WSJ called it "A Math Horror Show." The Daily Caller dropped the pretense and blamed "equity" outright.
The Workgroup report shows they knew how to be careful. The open letter shows they chose not to be.
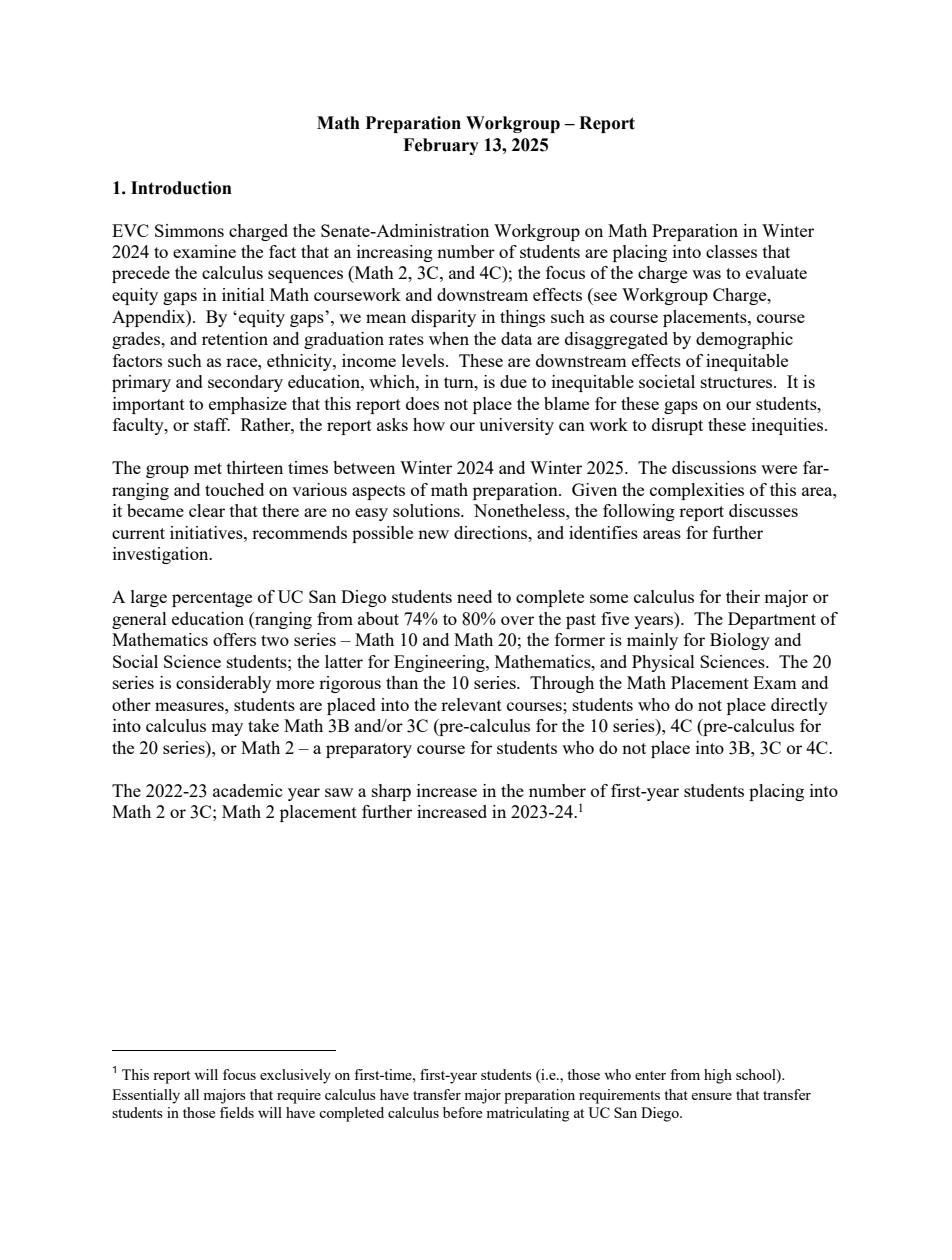
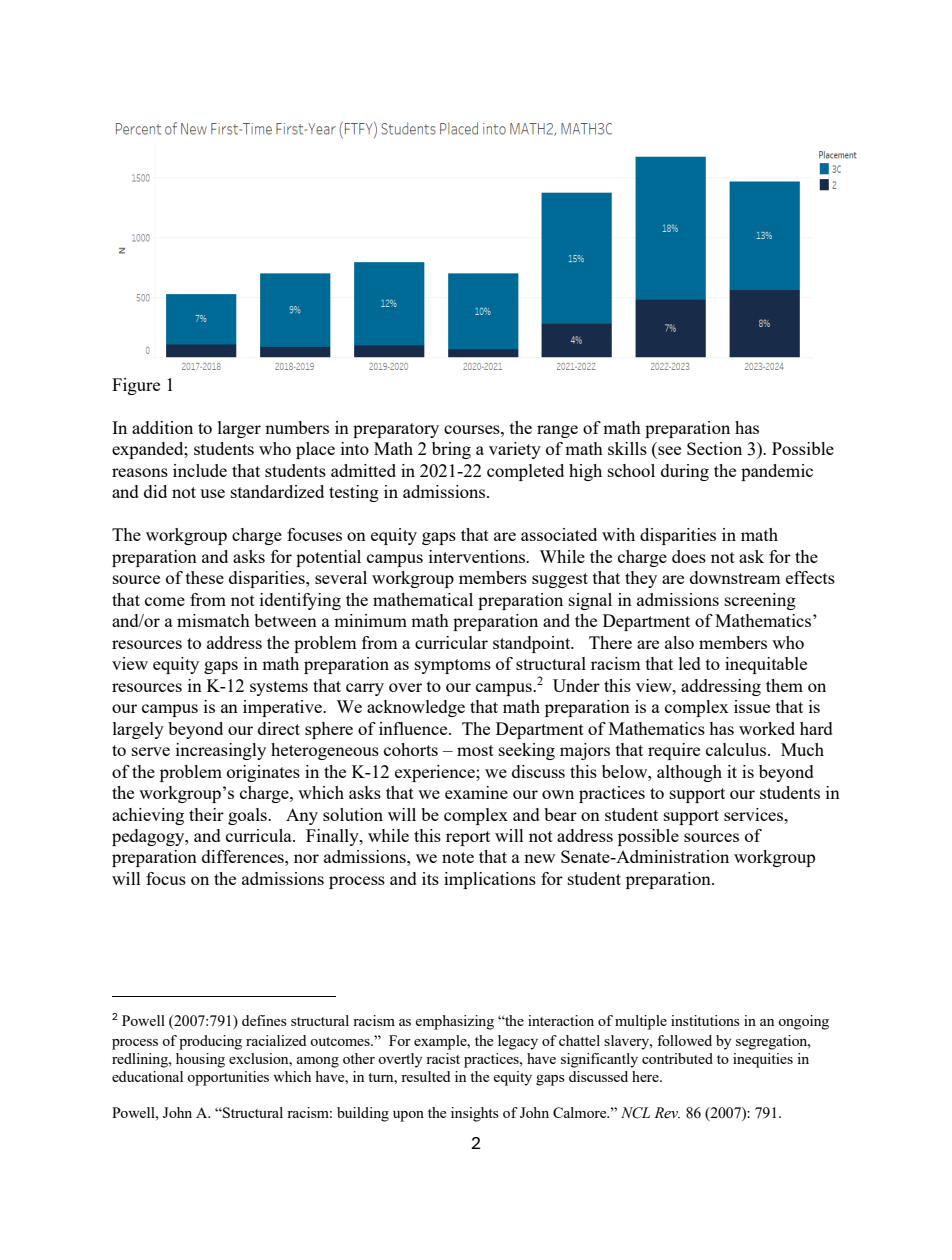
The Math Preparation Workgroup Report
While the MPW technically fulfilled its task, the report demonstrates the peril of siloed governance. By design, the report largely brushes past the complex policy ecosystem and treats this as a simple, isolated problem. Because it was forbidden from analyzing causes—like administrative process adjustments or changes in calculator policy—the report is forced to present a reductive view. Ingoring administrative changes and blaming student deficiencies, resulting in one solution: screen out more students.
Read the full MPW report (PDF) →
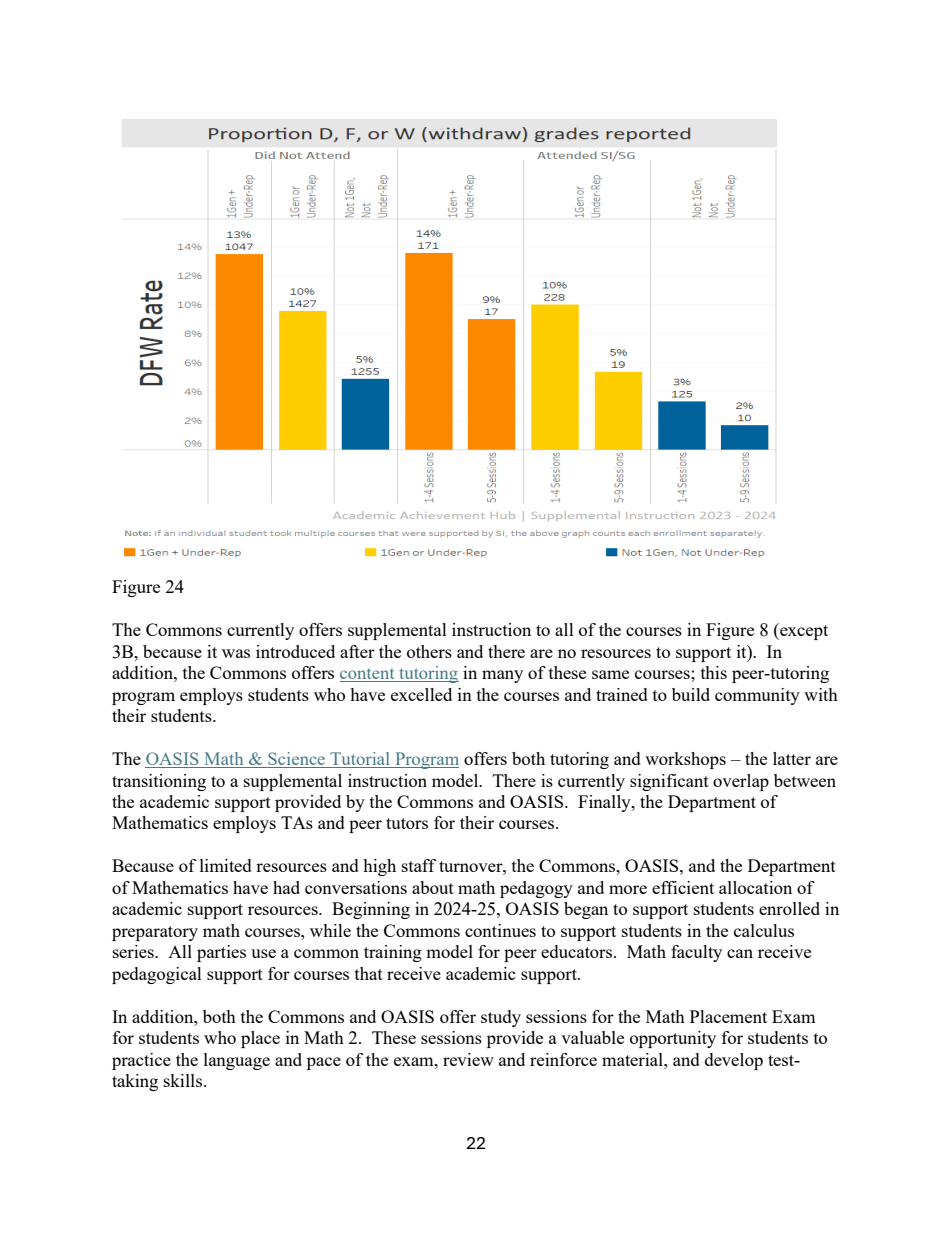
| Year | Admissions | Testing / Placement | Course Structure | Enrollment |
|---|---|---|---|---|
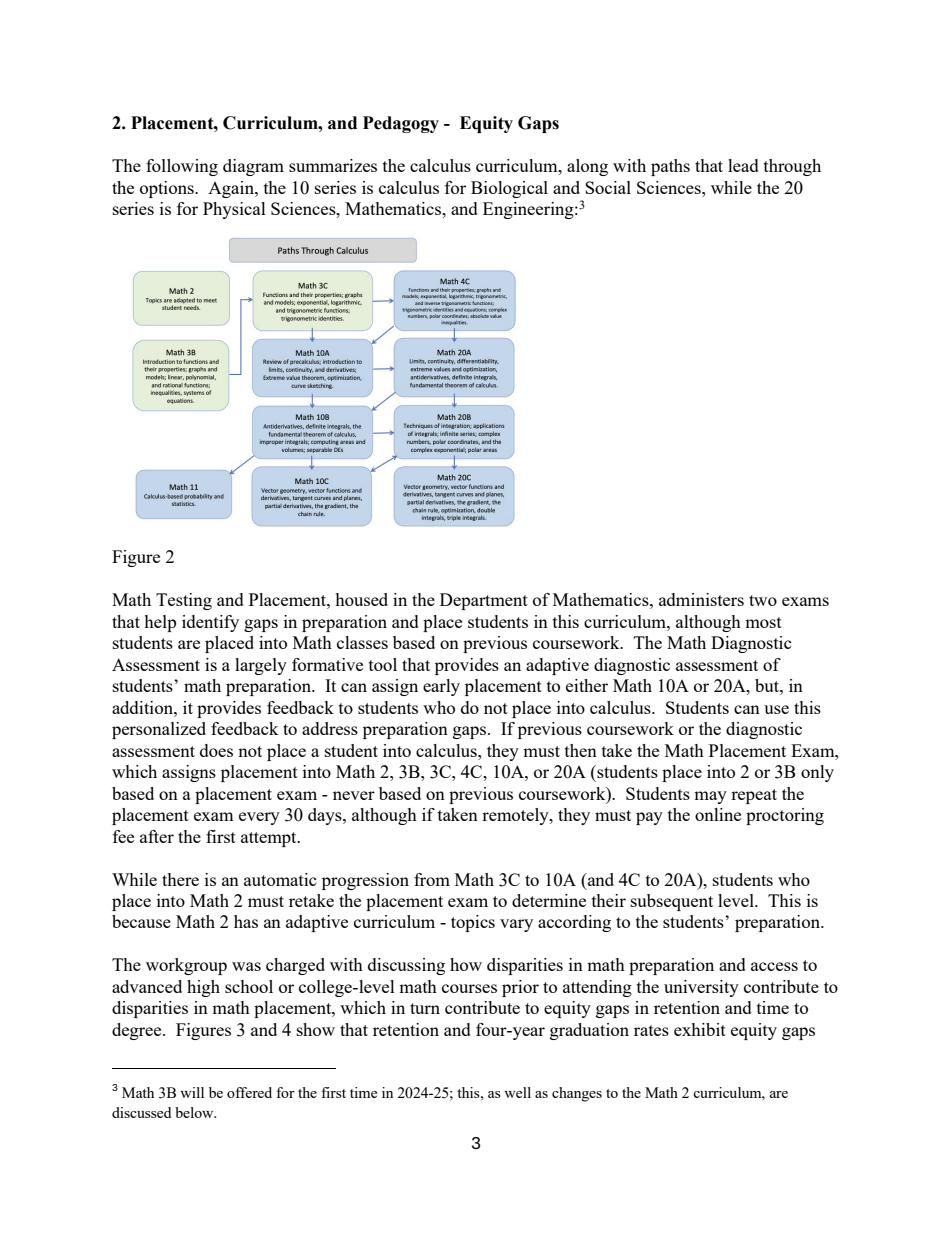
| 2019 | SAT/ACT required | Standard placement exam | Math 2 covers grades 9–10 | Math 2 ~1–2% of class |
| 2020 | Test-blind begins | Placement testing disrupted (COVID) | Math 2 covers grades 9–10 | Baseline year cited for "thirtyfold" statement |
| 2022 | Test-blind continues | No disclosed change | Math 2 covers grades 9–10 | Math 2 grows to ~400 |
| 2023 | Test-blind continues | Fall 2023 diagnostic administered (n=138) | Math 2 redesign begins | Math 2 grows to ~500 |
| 2024 | Test-blind continues | Placement cutoffs recalibrated; calculator banned on placement exam | Math 2 redesigned> to grades 1–8; Math 3B introduced | Placement counts shift due to recalibration |
| 2025 | SAWG recommends SAT/ACT reconsideration | — | — | ~8.3% ("1 in 12") in Math 2 |
How This Was Reported
The absence is the story. What gets amplified later is not what is most accurate. It's what is most usable. A careful, internally-scoped report that explicitly declined to assign blame or recommend testing changes generated essentially no public coverage: no op-eds, no wire stories, no cable segments. The most measured document in this chain was also the quietest.
The report is released. No one picks it up.
Still no coverage.
Silence is deafening.
The Senate Admissions Working Group Report
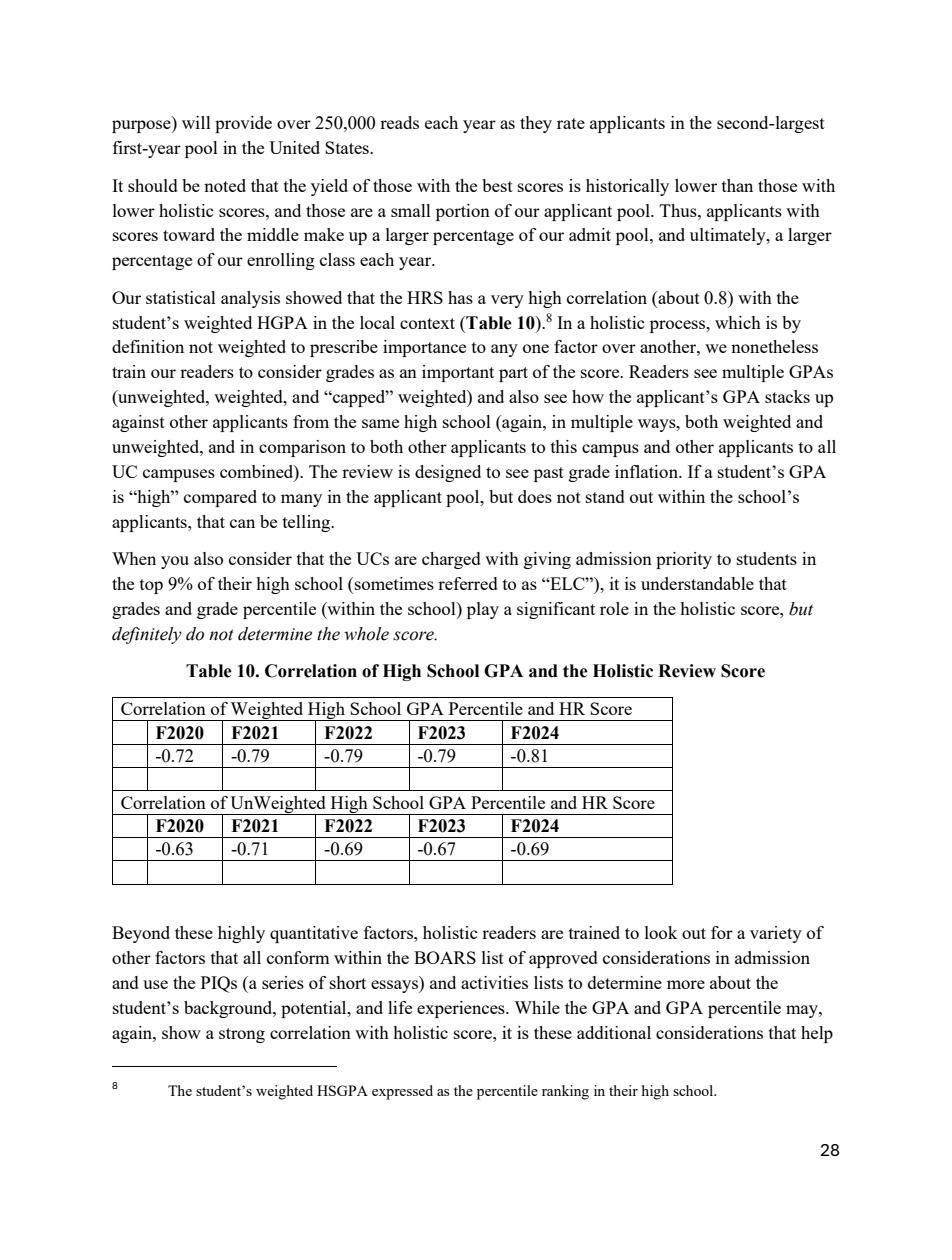
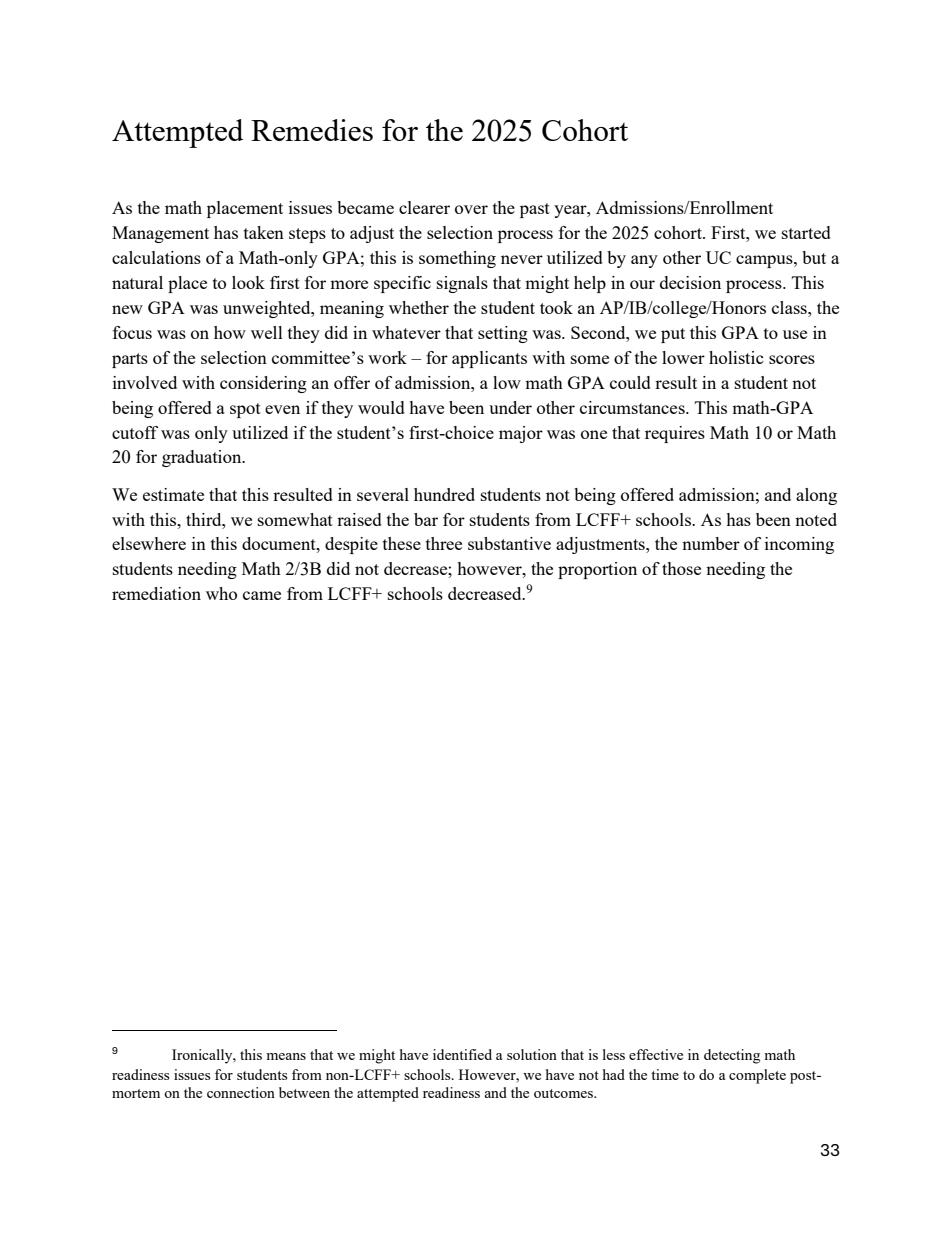
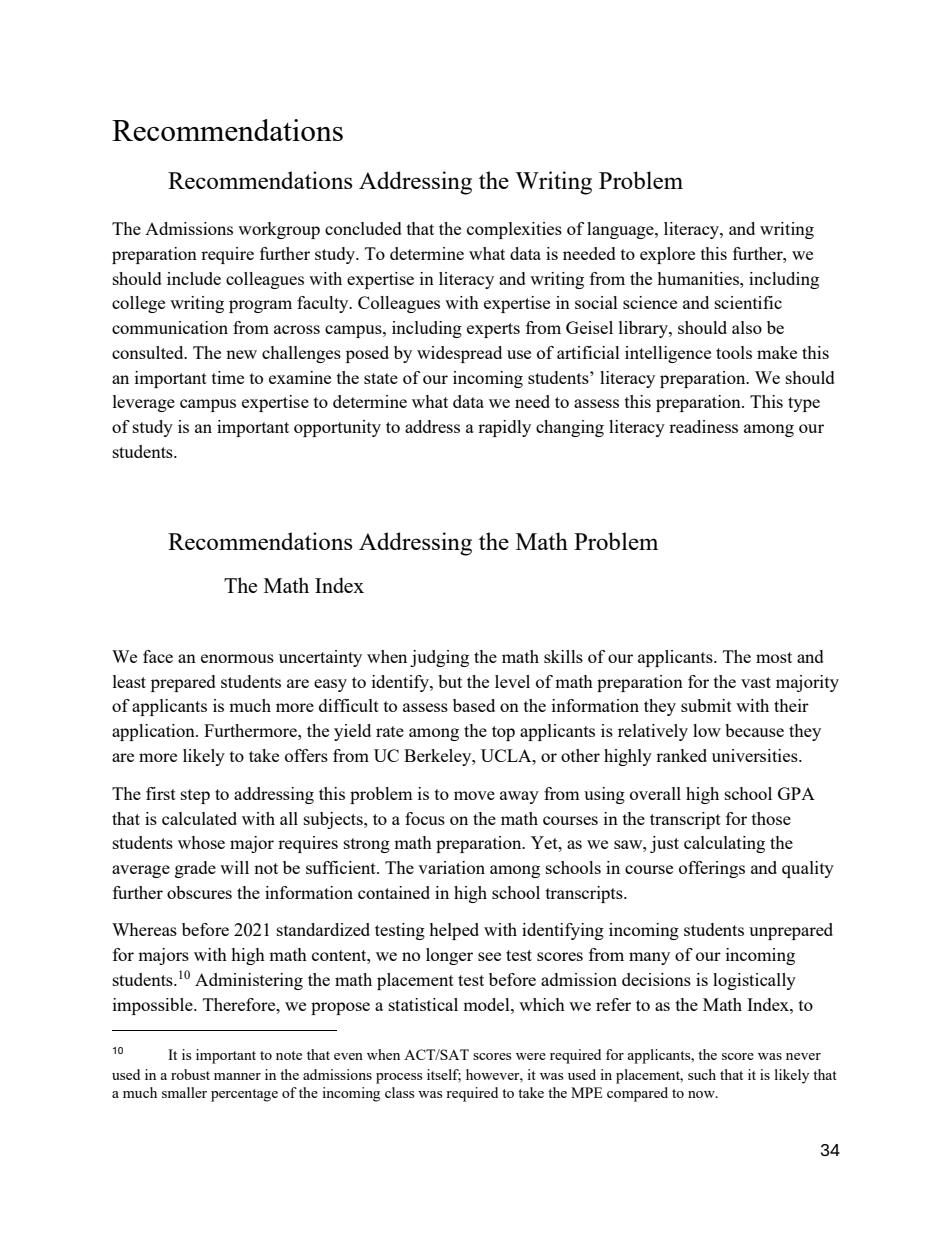
The SAWG report built on the MPW report in all the worse ways. It turned identified correlations into causation, it turned hedged assumptions into assertions of fact. It took the average score of 138 remedial math students on a low-stakes, anonymous test, compared it to the scores five pre-teens, and drew conclusions about 137,000 UC applicants. Then, to make it worse, it used the opinions of six tutors to imply students had learning disabilities and were cheating. The best/worst parts are highlighted below.
Read the full SAWG report (PDF) →
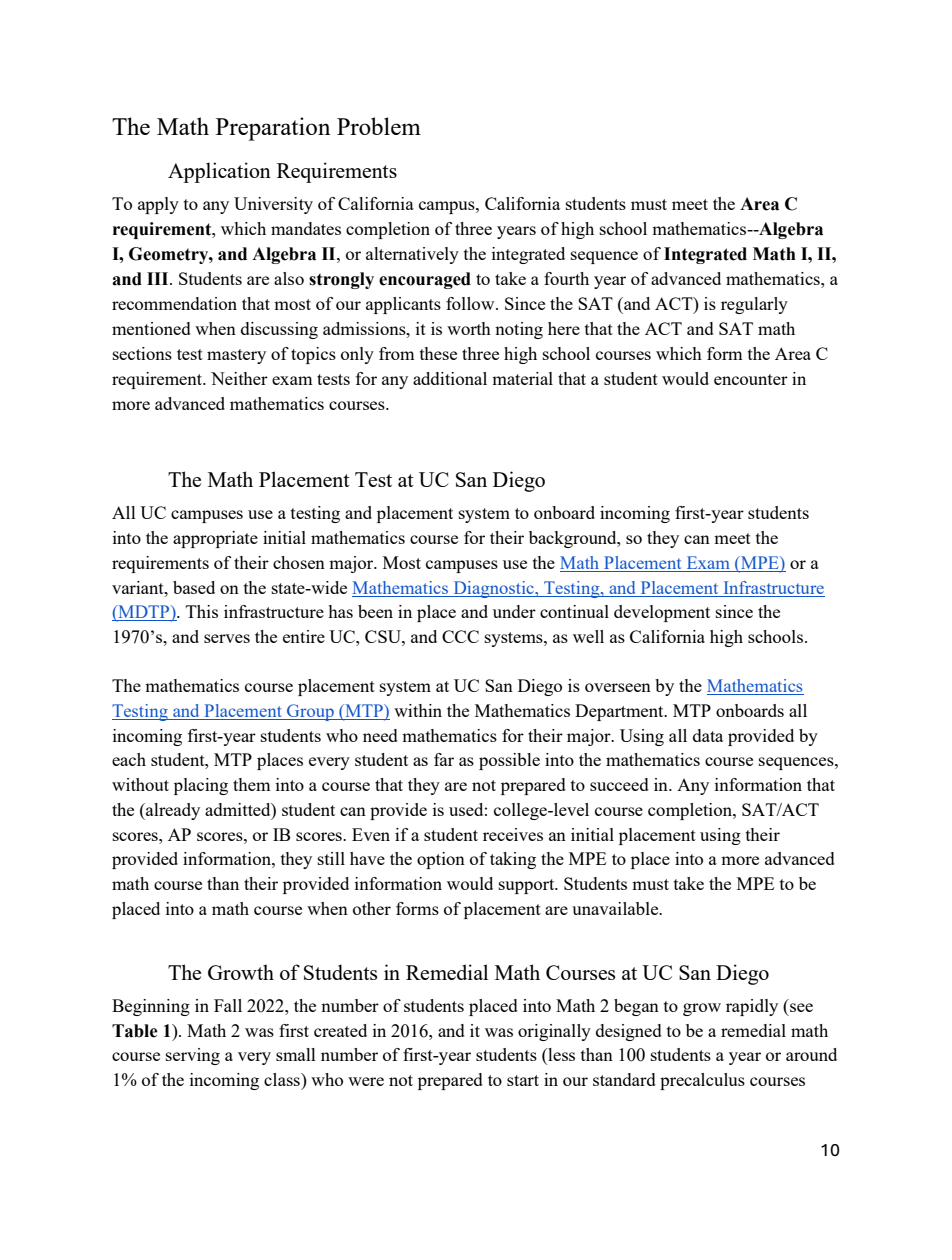
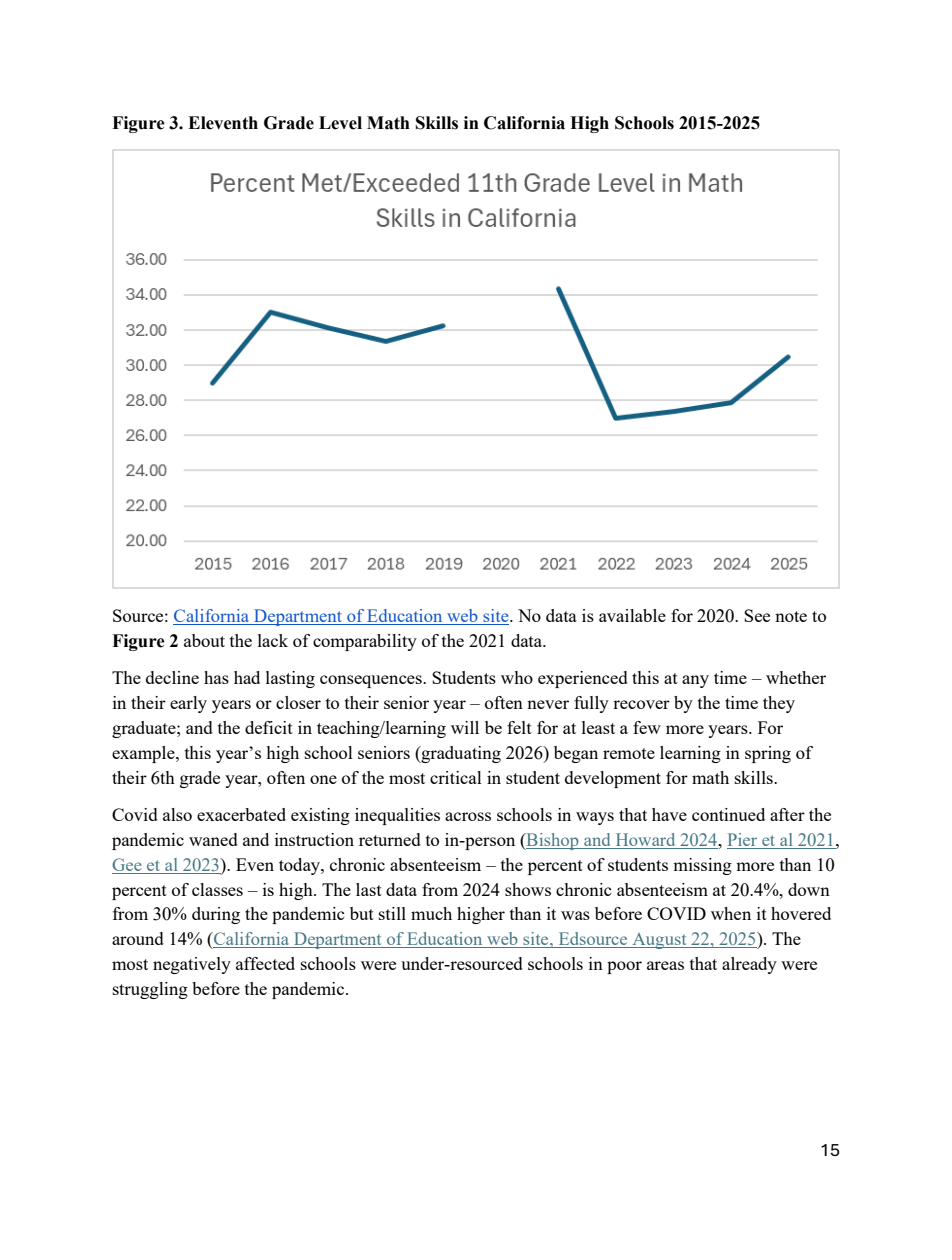
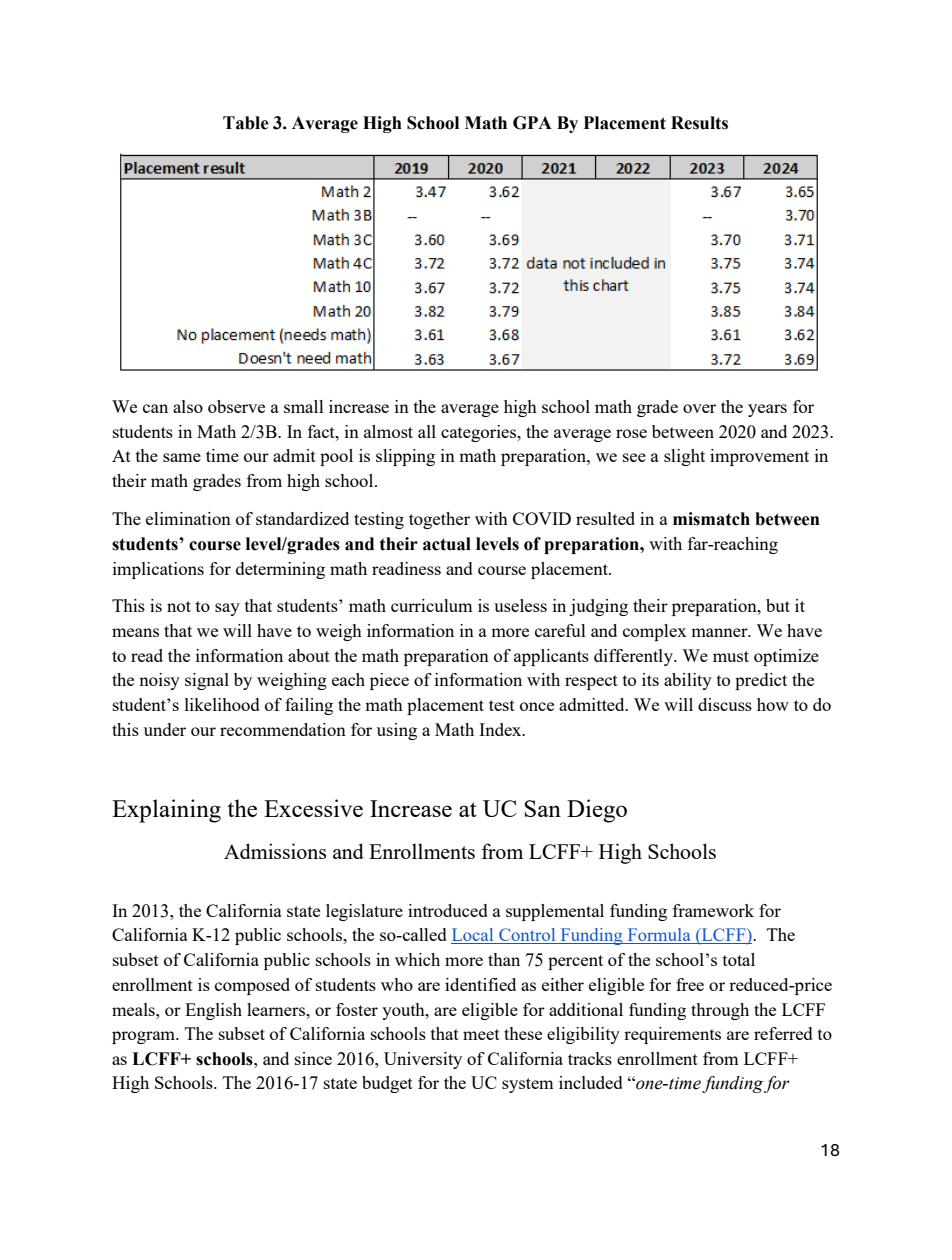
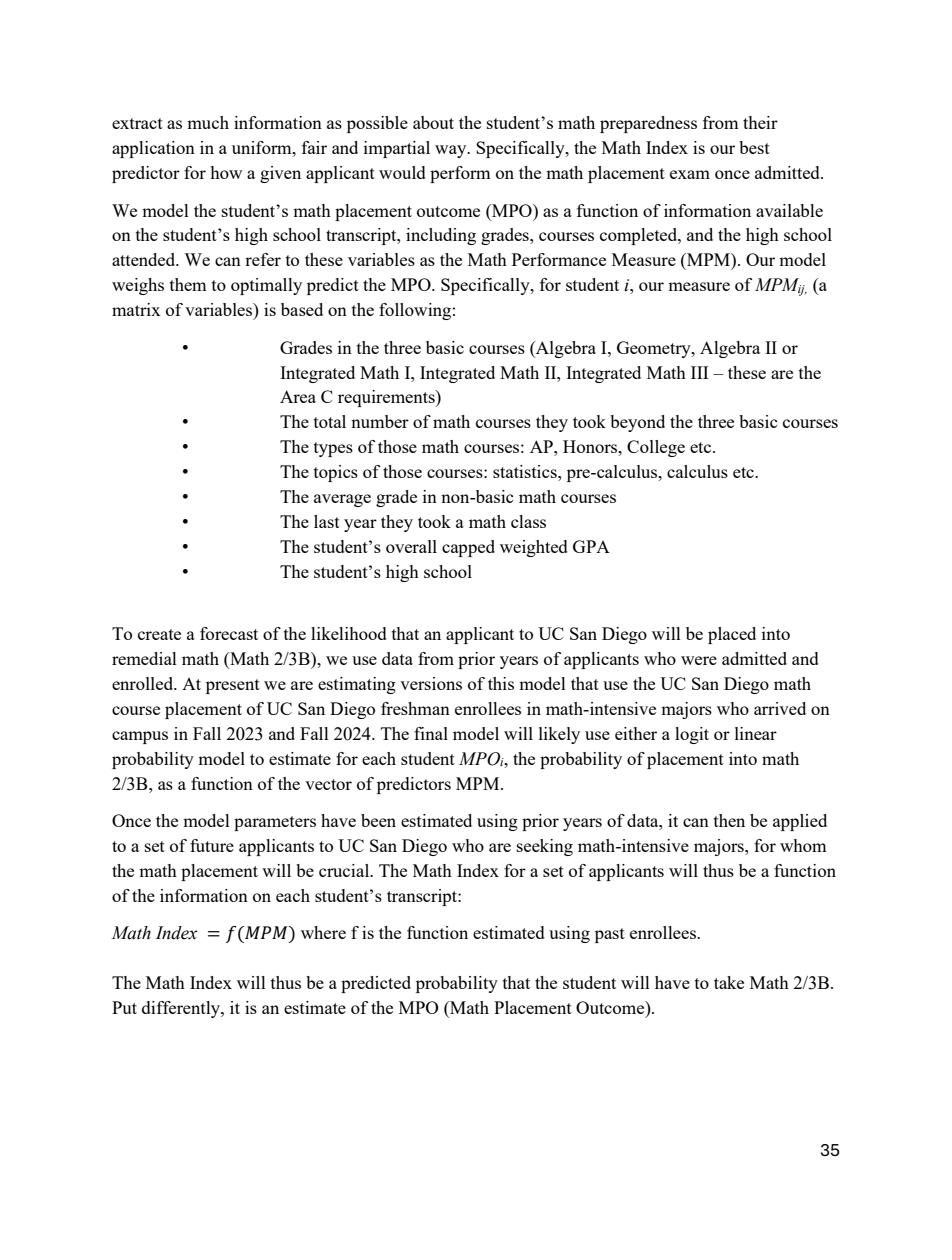
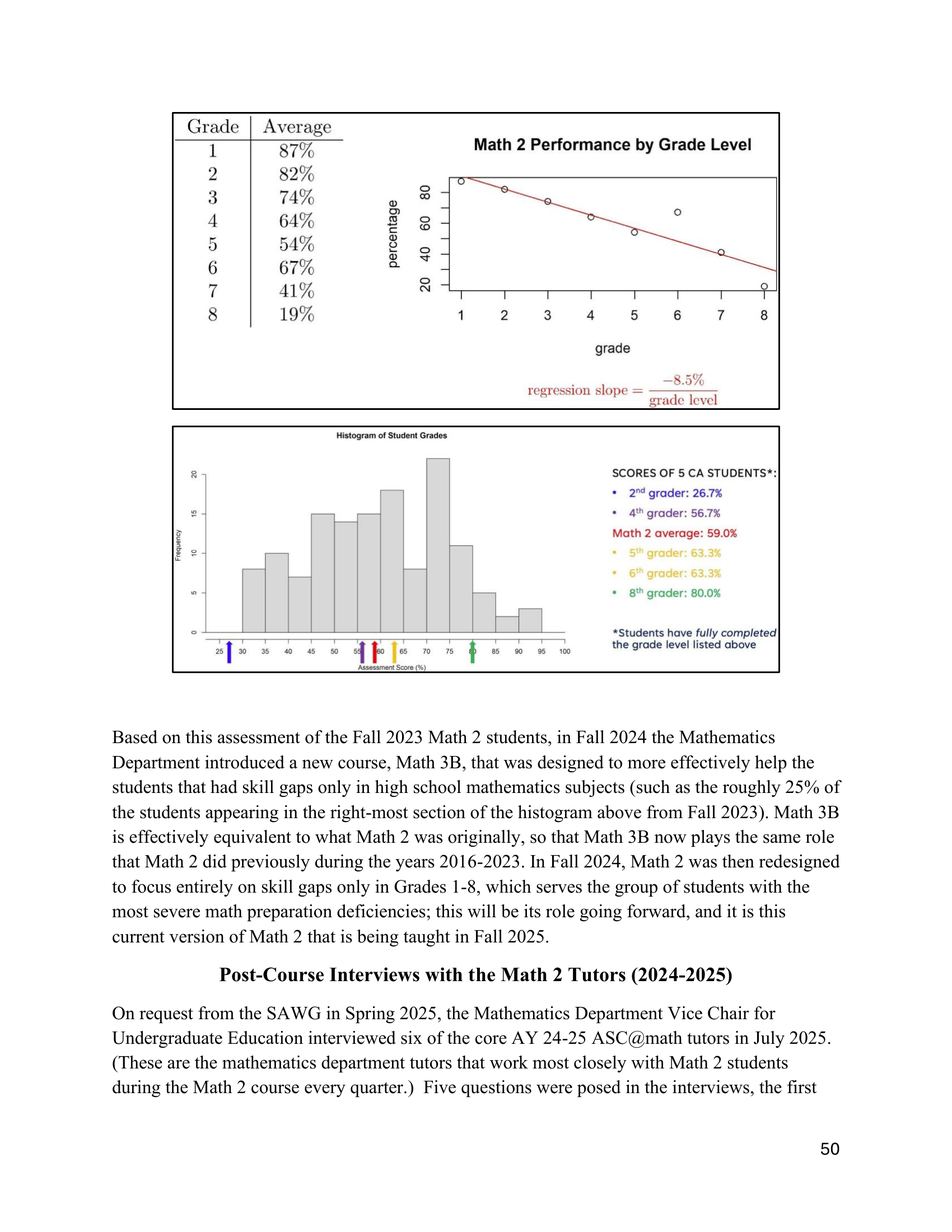
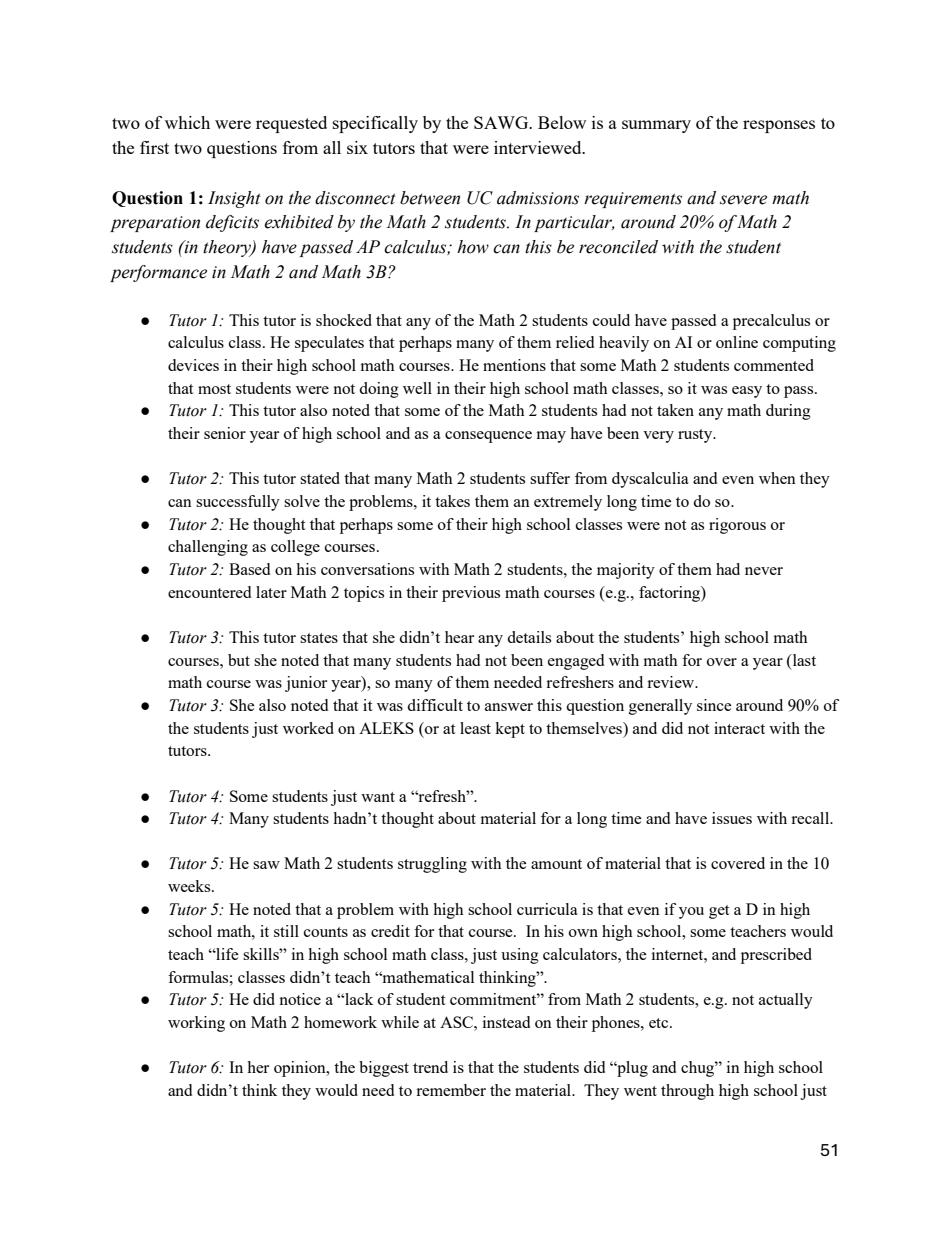
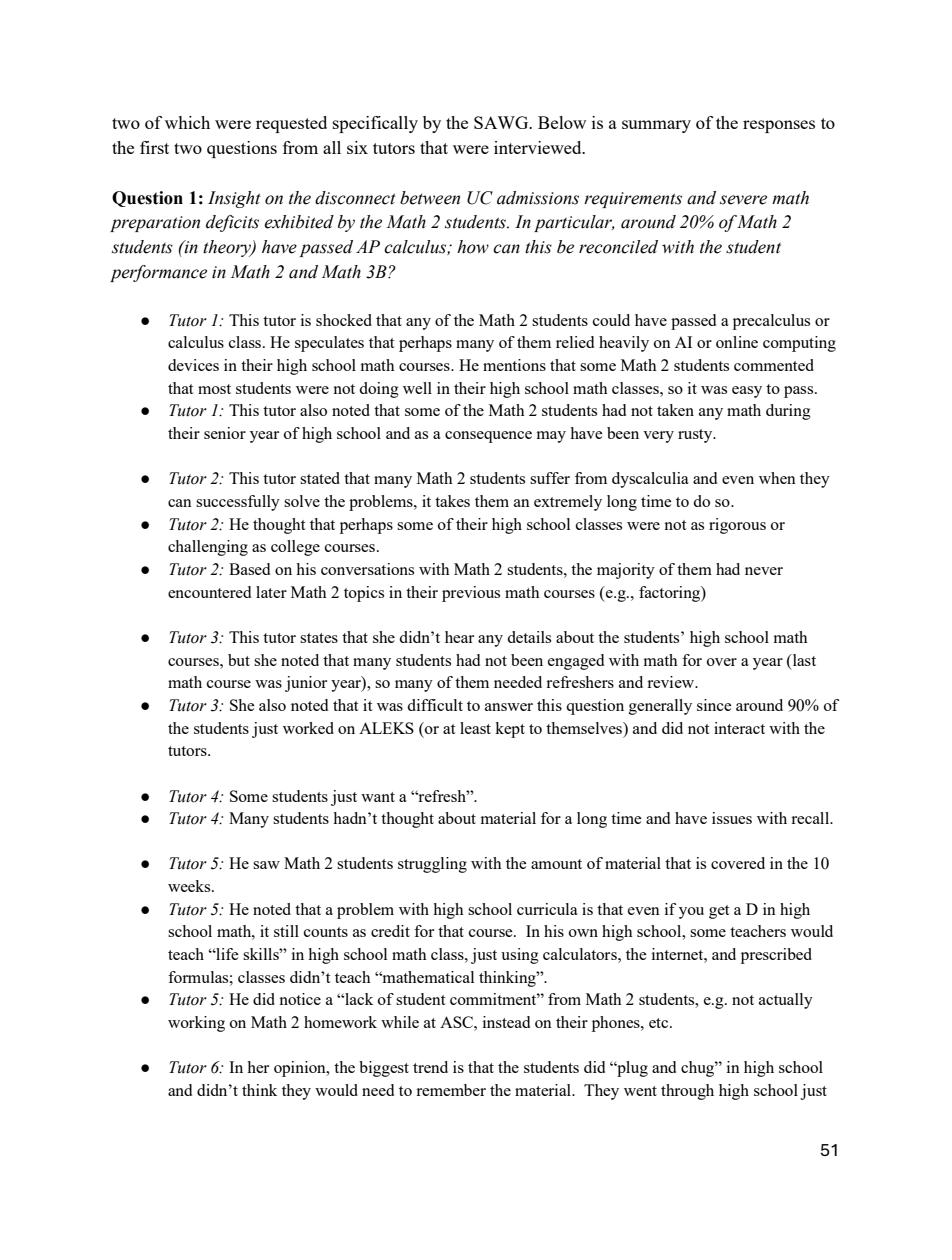
Take the assessment yourself
One report. Five kids. Your turn. Take a version of the assessment the SAWG report used, then compare your score to the UCSD students, and to the five pre-teens whose scores anchored the whole calibration.
Start QuizHow This Was Reported
The SAWG report generated real coverage. Each retelling drops a qualifier the previous version kept.
Students at California University Without 8th Grade Math Skills Skyrockets
The number of UCSD first-year students below Algebra 1 math has increased nearly 30-fold in five years, with 11.8% enrolling in remedial courses, driven by pandemic learning loss and grade inflation. Read article →
UC San Diego and the Crisis of Education
They need to reverse course, ignore the screaming of DEI dead-enders, and reinstate the SAT, ACT or CLT (the new Classic Learning Test) requirement to enable sufficient quality control in admissions and ensure college classes can be taught at a college level. Read article →
A Recipe for Idiocracy
According to the report, more than 60 percent of students who took the previous version of the course couldn’t divide a fraction by two.Read article →
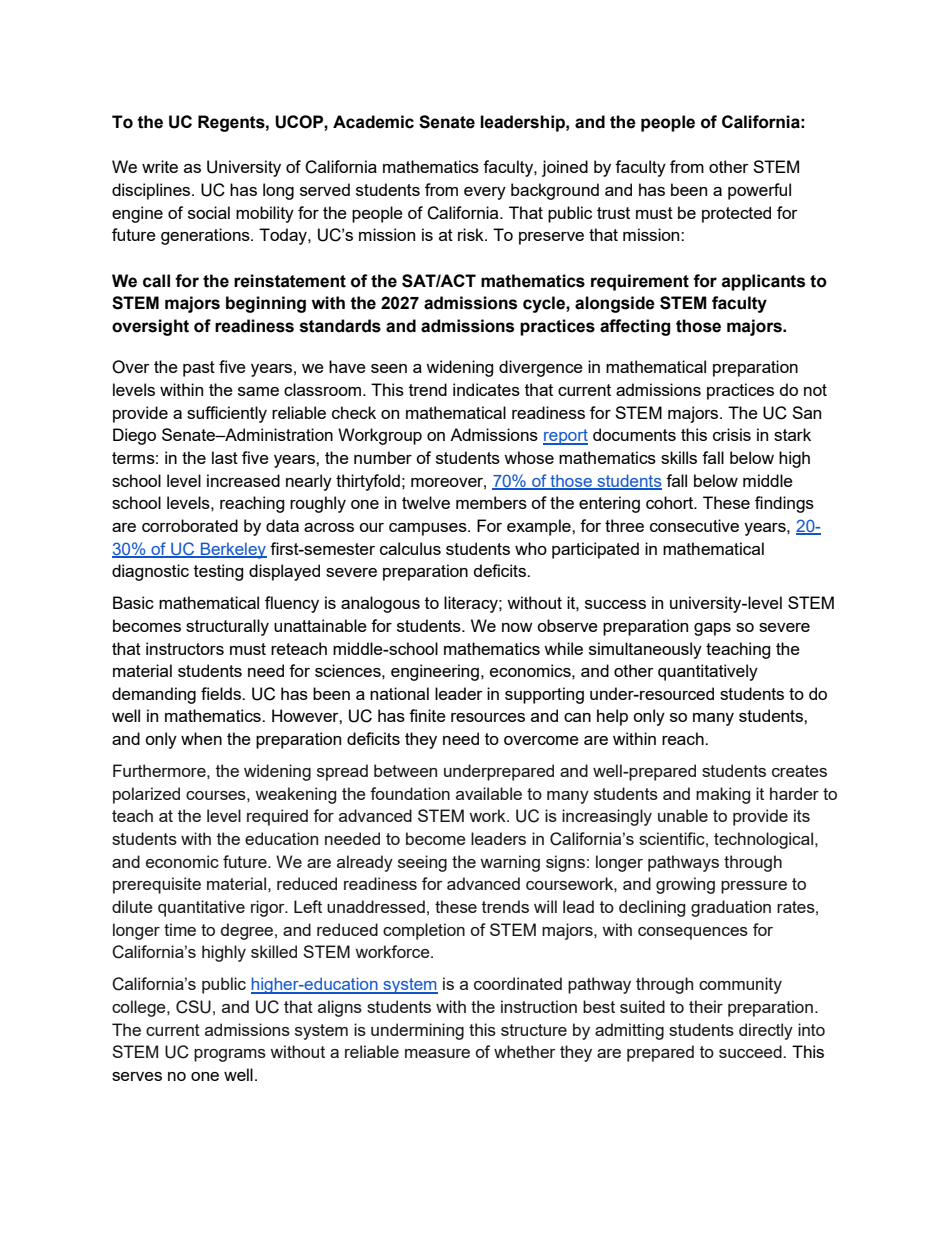
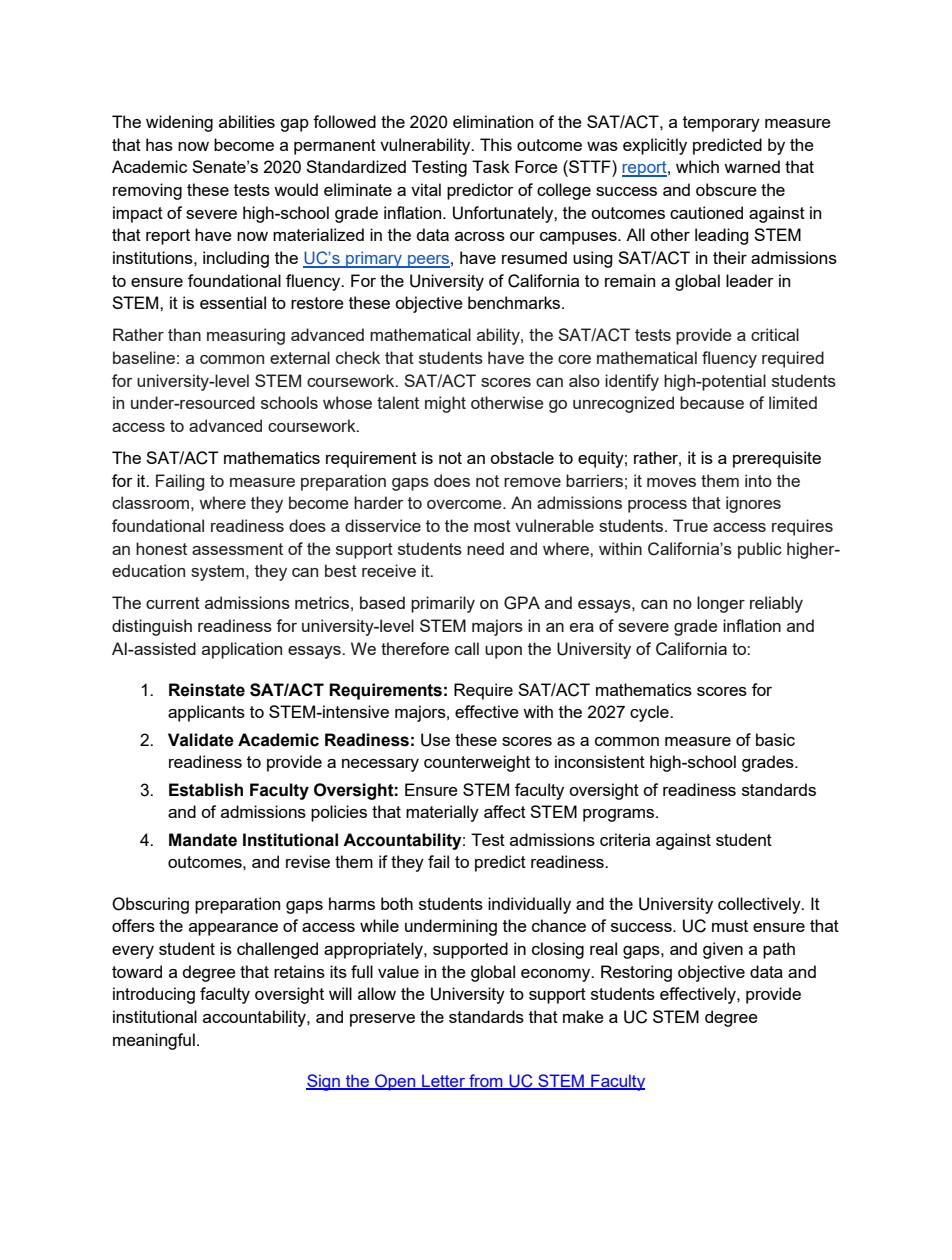
The Open Letter from UC STEM Faculty
The open letter takes the selective analytical work of the MPW, the correlations and conclusions of the SAWG, and rather than adding scholarship (as one would expect of STEM scholars), they lend their credentials and weight to deciding causation and demanding simplistic solutions, speaking of an access mission while promoting gatekeeping. Six months after SAWG. The hedge is gone entirely. A campus-level diagnostic and a placement statistic get framed by a vocal minority as a systemwide demand: reinstate the SAT and ACT for STEM admissions.
Read the full open letter (PDF) → · Read coverage of the letter →
Who Signed the Open Letter
19.1% of UC ladder-rank-and-equivalent faculty (12,055 total, April 2026) signed the letter, 8.8% against the stricter denominator of all instructional faculty (26,268 total). Of UCSD’s own Math Preparation Workgroup, whose data helped inspire the letter, 33.3% (7 of 21 members) signed it.
Source: UC Employee Headcount, universityofcalifornia.edu/about-us/information-center/uc-employee-headcount. A live, publicly checkable dashboard.
This section exists so you can check the letter’s signer base yourself rather than take "hundreds of faculty" at face value. It breaks down where signatures are concentrated by campus and rank, and lets you search the underlying list if you want to check a specific name, department, or campus. Individual names aren’t the point and aren’t shown by default, the concentration pattern is. UCSD and Berkeley aren’t just large in raw count, they saturate their own faculty at nearly double UCLA’s rate despite UCLA having the largest faculty body in the system, roughly a third of UCSD and Berkeley’s own colleagues signed, not a fringe.
Senior rank matters here specifically: full, distinguished, and emeritus faculty are, on average, further removed from direct classroom contact with first-year students than assistant professors, lecturers, and teaching faculty are. A signer pool concentrated at the senior end is disproportionately made up of people furthest from the students the letter describes.
| Campus | Signatures | % of all signers | Ladder-rank faculty | % of campus faculty |
|---|
Signature and saturation data: Hart-Hornor-Jones UC Open-Letter Signatory Explorer, hart-hornor-jones.github.io/signatory-analyzer.
How This Was Reported
Picked up by elitists, ideologues, and outlets that recast every debate in explicitly racial terms, the open letter becomes fuel for 100-year-old arguments about who deserves access to coveted spaces. What started as a policy debate loses its nuance and becomes an ideological fight. That isn't a distortion of the amplification chain. It's the chain's predictable endpoint, the place all the dropped qualifiers were always heading.
A Great University Undermines Its Mission
“Yet the declines in preparedness among University of California students are larger than the regression elsewhere, which underscores the role of the test-blind policy. California’s top public universities have essentially randomized aspects of the admissions process, admitting unprepared students while rejecting many who could thrive there.” Read article →
The SAWG report identifies multiple overlapping causes, including COVID, grade inflation, admissions changes, and testing policy. This sentence makes test-blind admissions sound like the clear cause.
STEM Professors In California Tired Of Teaching Stupid Kids For 'Equity'
Now, six years later, STEM professors awash under a human tidal wave of literal stupidity have decided to take action. (I'm not linking to this website)
The report describes serious preparation gaps. It does not describe students as stupid, nor does it blame students personally for systemic failures.
Universities Have Seller's Remorse
According to the report, more than 60 percent of students who took the previous version of the course couldn’t divide a fraction by two. (I'm not linking to this website)
The claim uses a striking placement-test item as a proxy for broad student ability, but the report’s larger finding is about readiness placement and preparation gaps, not a simple measure of intelligence or total math competence.
The Problem Was Real. The Evidence Was Thin. The Fix Is Wrong.
The reports identify a real concern: more students are being placed into remedial math. But the evidence is thinner than the crisis story suggests. Small samples, shifting placement rules, COVID disruption, calculator policy changes, grade inflation, and unequal high-school opportunity are treated as background noise instead of competing explanations. The reports do not prove that test-blind admissions caused the problem, and the proposed remedy does not match the problem. A placement problem needs placement evidence. A preparation problem needs preparation support. Reinstating a broad admissions screen does neither.
Five Places the Evidence Gets Stretched
Small samples are carrying large claims.
Five calibration students, six tutors, and 138 students already placed into the lowest remedial track are not nothing. They are also not enough to carry a systemwide admissions claim.
The measuring stick changed.
Placement rules, course structure, calculator policy, and remedial course definitions changed across the period being analyzed. When the measuring stick changes, the trend line changes too.
The crisis depends partly on where the clock starts.
Starting with 2021 makes the story look cleaner and more sudden. Looking back to the longer pre-2020 pattern complicates the causal story.
Too many causes are compressed into one explanation.
COVID disruption, high-school course access, grade inflation, admissions expansion, calculator policy, and unequal school resources all overlap. The reports mention some of these variables but do not actually isolate them.
The proposed fix screens students earlier.
If the problem is placement and preparation, the solution should be placement, bridge instruction, tutoring, co-requisite support, summer math, and better high-school-to-college alignment. SAT/ACT reinstatement is a sorting response to an instructional problem.
The reports ask broad admissions tests to answer a course-placement question.
The problem is not comparison. The problem is using broad admissions tests as the remedy for a placement and preparation problem. A department trying to place students into a course sequence needs subtopic-level evidence: functions, logarithms, trigonometry, rational expressions, identities, and fluency with the prerequisites for the next course.
| The real question | What answering it would require | What SAT/ACT provides | Why it falls short |
|---|---|---|---|
| Is this student ready for precalculus?SAWG, footnote 15: SAT 650 / ACT 24 “is an accurate predictor of success in Math 4C” | Evidence of specific skills: functions, logarithms, trig identities, rational expressions. | A composite score across algebra, data analysis, geometry, and a thin sample of advanced topics. The Digital SAT has no logarithm items. Neither test covers trig identities. | Neither College Board nor ACT claims their test is an “accurate predictor.” Both report probability of earning a B or higher for a population. The score shows general math strength, not which skills are present or missing. |
| Can a cut score predict this individual student’s outcome?SAWG, footnote 15: SAT 600 / ACT 21 “is an accurate predictor of success in Math 3C” | Evidence that a score correctly identifies individual readiness, not just that students with higher scores tend to do better as a group. | A population-level probability that shifts by institution type. At a selective institution like UCSD, a student scoring 600 has roughly a 60% chance of earning a B or higher and a 40% chance of not, per College Board’s own placement research. | A single cut score assumes the score-to-performance relationship is uniform. College Board’s own data shows it isn’t. The score can’t tell you which side of that probability an individual student falls on. |
| Will requiring these tests improve outcomes?SAWG: “the single best predictor for math placement” | Evidence that scores improve placement accuracy, persistence, or completion, not just that they correlate with grades. | Correlation between scores and first-year math performance. No evidence that requiring the test improves outcomes compared to not requiring it. | Research shows SAT/ACT can predict that a student may struggle. That is not the same as helping them succeed. The test identifies a gap. It does not close it. |
| Does this serve the UC mission to serve underserved students?Open letter: “identify high-potential students whose talent might otherwise go unrecognized” | A tool that distinguishes ability from opportunity. | SAT/ACT scores are screening tools that reflect differences by income, school type, and parental education. | Test scores correlate with structural inequality. Using the score as a screener shifts the consequences of that inequality onto individual students. Asking one number to simultaneously screen out and discover talent requires it to do opposite things. |
Citation for all footnote-15 claims: UCSD Student Academic Workforce Group, Report on Admissions Review, p. 44, footnote 15. Exact text: “an SAT (math) score over 600 (or an ACT score over 21) is an accurate predictor of success in Math 3C, whereas an SAT (math) score over 650 (or an ACT score over 24) is an accurate predictor of success in Math 4C.”
| Instrument | Primary function | What it reports | Useful for | Why it fails if overused |
|---|---|---|---|---|
| SAWG Basic Skills Assessment | Local diagnostic snapshot | Raw score and grade-band interpretation | Seeing severe gaps among already-remedial students | Not systemwide causal proof about admissions policy |
| MDTP | Diagnostic support / placement guidance | Raw performance and topic-level information | Placement, advising, and instructional planning | Not comprehensive proof of future success in a course |
| SAT Math | Broad admissions readiness / ranking signal | Scaled score and broad domains | Ranking, broad readiness, and risk signaling | Not subtopic-level diagnosis for a specific course sequence |
| ACT Math | Broad admissions readiness / ranking signal | Scaled score and broad domains | Ranking, broad readiness, and risk signaling | Not subtopic-level diagnosis for a specific course sequence |
ACT Math 24 shows the problem.
ACT Math 24 = roughly 25 correct out of 41 scored math items. A student could ace all 23 non-calculus-relevant items and need only 2 of the 18 calculus-relevant items correct. That is about 36% accuracy on the content that matters for Math 4C, the course SAWG’s footnote 15 actually pairs with an ACT score of 24.
The composite makes this worse. A 30 English / 18 Math / 24 Reading profile composites to 24. A student with an 18 in math could satisfy a 24 composite threshold because English and Reading carried the average.
What the Stronger Evidence Shows
The stronger technical record does not deny the preparation problem. It shows why SAT/ACT reinstatement is too blunt a solution for the problem the reports describe.
Norm-Referenced Tests and Race-Blind Admissions
Geiser argues that once income and race are controlled for, high-school GPA outperforms SAT scores as a predictor of college outcomes. That complicates the claim that SAT/ACT reinstatement is the obvious evidence-based fix.
Read source →What If the SAT Is the Cause of Our Math Problems?
Boeckenstedt checks widely repeated Berkeley remediation claims against archived pages and timing. Some cited statistics predate UC test-blind admissions, which means they cannot prove a test-elimination effect.
Read source →Mathematics Diagnostic Testing Project
MDTP is more diagnostic than SAT/ACT, but even MDTP disclaims use as a comprehensive indicator of success in any mathematics course. That matters when reports place heavy interpretive weight on placement-test performance.
Read source →Remedial Enrollments Surged at UCSD Amid Shifting Placement Testing Conditions
Burdman shows that placement conditions changed, including calculator policy and course placement rules. That makes the clean test-blind-causation story harder to sustain.
Read source →An In-Depth Exploration of SAT Math Scores for Use in College Course Placement
College Board placement research treats SAT Math as useful risk information. Risk information is not the same as subtopic-level diagnosis or proof that reinstating admissions testing will solve course-placement problems.
Read source →What Better Reporting Found
The better reporting did not take one data point and spin a story of a failing American school system. It didn't cast blame on policies it didn't like. It didn't play the elitism game. It explored what the dataa revealed, it asked questions. It asked what produced the results, what the numbers could actually prove, and what response would help students.
What the Internet Backlash Over Remedial Math at UC San Diego Misses
Barnum asked why students got items wrong instead of simply treating the misses as proof of deficiency. That is the reporting move most of the amplification chain skipped.
Read article →San Diego Math Decline Reveals Need for Statewide Strategy
Burdman frames the issue as a need for statewide preparation strategy rather than admissions gatekeeping. The policy target shifts from excluding students to building capacity.
Read article →The Bigger Picture Beyond the UCSD Math Report
Math researchers Burdman and Rios looked beyond one campus's situation to explore the broader question of math preparation. It keeps the evidence local instead of turning it into a universal admissions-policy verdict.
Read article →Reinstate SAT? UC Faculty Pushback Gets Complicated
Burke reports named skepticism, stable UCSD STEM retention, and departments that declined to sign the open letter. That makes the story less like faculty consensus and more like a contested campaign.
Read article →The answer is not pretending the gap is fake. It is building the support the gap requires.
If SAWG and the open letter had stayed inside UC’s access mission, the demand would not have been exclusion by test score. It would have been statewide preparation, transparent placement, bridge courses, co-requisite support, tutoring, summer math, and better high-school-to-college alignment. Those solutions already exist. The next section shows them.
See the alternatives →Same Problem. Two Policies. Only One Became a Culture War.
Between 2020 and 2025, UC San Diego and the SUNY system both documented the same underlying pattern: a real, “record” drop in incoming students’ readiness for college-level math. What each system did next diverged completely, and so did what happened to the story.
 UCSDAdmissions screen
|
 SUNY / UAlbanyInstructional support
|
|
|---|---|---|
| Diagnosis | Treated as an admissions-screening failure with a preferred solution to be justified | Treated as an instructional-support gap |
| Remedy | SAWG and the open letter recommend reinstating SAT/ACT | SUNY-wide gateway course redesign (Academic Momentum Campaign, launched Fall 2025); at UAlbany, mandatory weekly tutoring, 375 peer-led supplemental instruction sections, a dedicated calculus coordinator |
| Disclosure | No release strategy: the SAWG report was posted routinely for Academic Senate comment, discovered first by the UCSD Guardian, and extracted nationally within two weeks | Numbers given directly to one regional reporter (Times Union); never issued as a systemwide press release |
| National coverage | Entered pre-existing national debates already in motion: test-optional admissions, the 8th-grade algebra/math-pathways fight, elite-admissions scrutiny. Broad, ideologically split popular attention across separate ecosystems: The Atlantic, Fox News, Forbes, Chalkbeat, College Fix/ACTA commentary, a U.S. Senate HELP Committee inquiry. | Entered no pre-existing national debate. Mostly institutional and regional: SUNY press releases, Times Union. Conservative aggregators (Gateway Pundit, Legal Insurrection, Instapundit) picked it up days later, but it never became a national story — there was no live conversation for it to attach to. |
| Reaction | The open letter (Stage Three) actively sought national attention, invoking peer institutions and the national testing debate. The report itself did not. | No equivalent public campaign at any stage |
UCSD disclosure trace: SAWG report submitted to UCSD Academic Senate Nov. 6, 2025, for routine comment period (comments due Dec. 8); first public report was the UCSD Guardian, Nov. 17, 2025; picked up by UCLA Faculty Association blog and Xinhua by Nov. 19.
SUNY’s 25%/22% failure figures come from the Times Union (Kathleen Moore, July 17, 2026) — not a SUNY press release.
The data didn’t determine the policy. Each system’s own theory of the problem did, and only one of them needed a culture war already in progress to make its recommendation land.
Four-Year Graduation Rates: No Clean Story Either Way
| Cohort | UCSD rate | Testing | MIT rate | Testing | UAlbany rate | Testing |
|---|---|---|---|---|---|---|
| 2016 | 71.6% | Required | 88.7% | Required | 58.0% | Required |
| 2017 | 74.9% | Required | 82.3% | Required | no data published | Required |
| 2018 | 73.6% | Required | 82.7% | Required | 53.9% | Required |
| 2019 | 74.2% | Required | no data published | Required | no data published | Required |
| 2020 | 77.5% | Test-optional | no data published | Test-optional (COVID) | no data published | Test-optional |
| 2021 | 78.0% | Test-free | no data published | Test-optional | no data published | Test-optional |
| 2022 | no data published | Test-free | no data published | Test-optional | no data published | Test-optional |
| 2023 | no data published | Test-free | no data published | Reinstated | no data published | Test-optional |
| 2024 | no data published | Test-free | no data published | Required | no data published | Test-optional |
2020 onward hasn’t reached the 6-year threshold for any standard disclosure. UCSD is the only one of the three publishing outside this cycle.
Test-free timeline: UC went test-blind for Fall 2021 admissions via court order (Sept. 2020 ruling), ahead of the Regents’ original 2023 target.
MIT reinstated testing for its Fall 2023 cohort specifically because it believed testing would improve outcomes. Whether it did is not yet knowable — that cohort’s four-year rate won’t exist until 2027. In the meantime, the only two schools with pre/post data both moved in directions their testing status doesn’t explain: MIT fell six points and UAlbany fell four and a half, both while testing was required. UCSD rose six points over the same window, first under required testing, then optional, then free, with no visible break at any transition. The honest conclusion is that nobody currently has the data to claim testing policy, in either direction, is driving these numbers.
Model for Higher Ed Institutions
Manage Your Own Publicity. Don’t Outsource It to the Outlets.
An institution that releases sensitive placement data into a polarized media environment cannot assume it will be read fairly. UCSD’s own MPW report was careful and got zero coverage. The SAWG report was posted the same way — routine Senate business, no communications plan behind it — and got extracted within two weeks by a student newspaper, then a wire service, then national outlets each reading it through their own frame. SUNY, by contrast, gave its numbers to a single regional reporter rather than issuing a systemwide report, and the story stayed local. The difference wasn’t luck. It was whether anyone planned for the release at all.
Solution: Institutional research offices need a release strategy, not just an accurate report. Contextualize findings before publication. Pair diagnostic data with the institution’s actual response. Anticipate which parts of the report are extractable as a headline before an outside outlet extracts them first.
The Firestorm Followed the Demand, Not the Data
The UCSD story didn’t ignite over a quiet placement-exam change. The calculator ban stayed undisclosed until Just Equations found it in February 2026, more than a year after the story was already national news. What actually triggered coverage was SAWG’s and the open letter’s explicit ask: reinstate the SAT and ACT. That ask landed inside an already-charged California conversation about 8th-grade algebra timing and math-pathway tracking, a fight that predates this report by years. The story was primed to catch fire before UCSD lit the match.
Solution: When a report’s recommendation touches an active statewide fight, expect amplification proportional to the recommendation, not the underlying data. Plan disclosure and framing around the ask being made, not just the numbers behind it.
Even a Higher-Prestige Version of “Teach, Don’t Screen” Gets Weaponized, Just Differently
Harvard added Math MA5 in fall 2024, a version of its standard introductory calculus course that meets five days a week instead of four, same material, same exams, aimed at students affected by pandemic-era learning gaps (Harvard Crimson, Sept. 3, 2024). The story sat uncontroversially for seven months. Then in spring 2025 an advocacy-nonprofit CEO screenshotted the year-old article on X and mislabeled the course “remedial algebra.” Fox News tied it to test-optional admissions policy (Fox News, April 7, 2025), and the claim escalated to President Trump calling it “remedial mathematics… like two plus two is four” from the Oval Office, entangled with the administration’s separate funding fight against Harvard. The outside math professor who’d reviewed Harvard’s department called the label flatly false: “It’s a rigorous calculus course” (Boston Globe, June 8, 2025).
Harvard’s attention wasn’t the same kind of national story UCSD’s was. It didn’t enter a broad, multi-ecosystem debate the way UCSD’s report did — test-optional admissions, math pathways, elite scrutiny, all running simultaneously across separate outlets with separate agendas. It became a talking point inside one narrower, ongoing fight: the Trump administration’s targeted campaign against Harvard specifically. Remove that fight and there’s little reason to think a five-day-a-week calculus section makes news at all. UCSD’s report needed an existing culture-war infrastructure to get amplified. Harvard’s needed one man’s fixation on one university.
What actually works
None of these institutions reinstated a test to solve a comparable readiness problem, and for good reason: the construct has changed underneath it, the item pool is noise-dominated, and its scores carry a documented socioeconomic gradient. Each redesigned the course, the support structure, or the placement process instead, not the gatekeeper, and each has real outcome data to show for it.
Four models, already working
Different mechanisms, same result: closing the readiness gap without adding a gatekeeper.
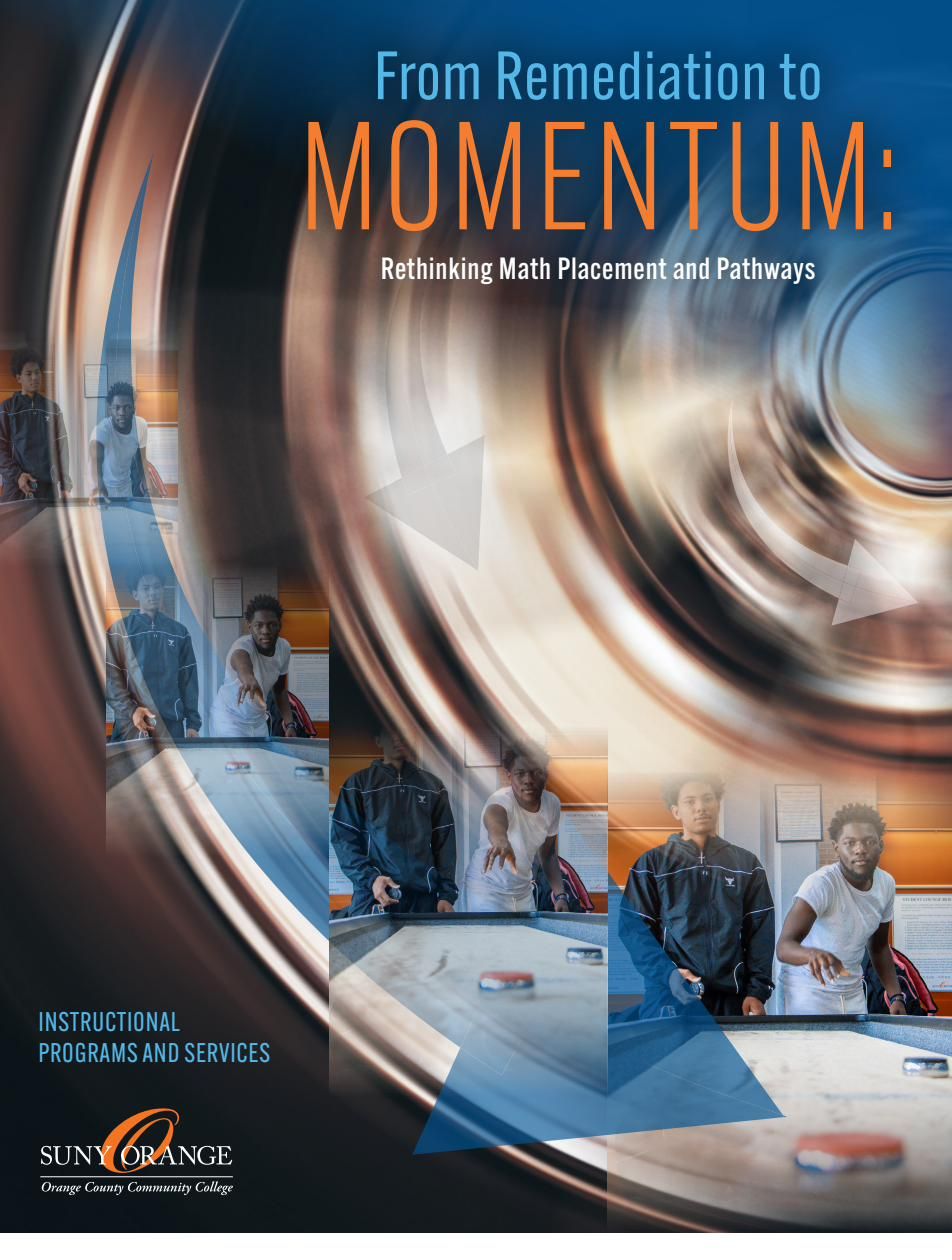
One-year gateway math completion: old placement testing system vs. new guided self-placement / corequisite model. Equity gaps for Black and Hispanic students narrowed.
sunyorange.edu →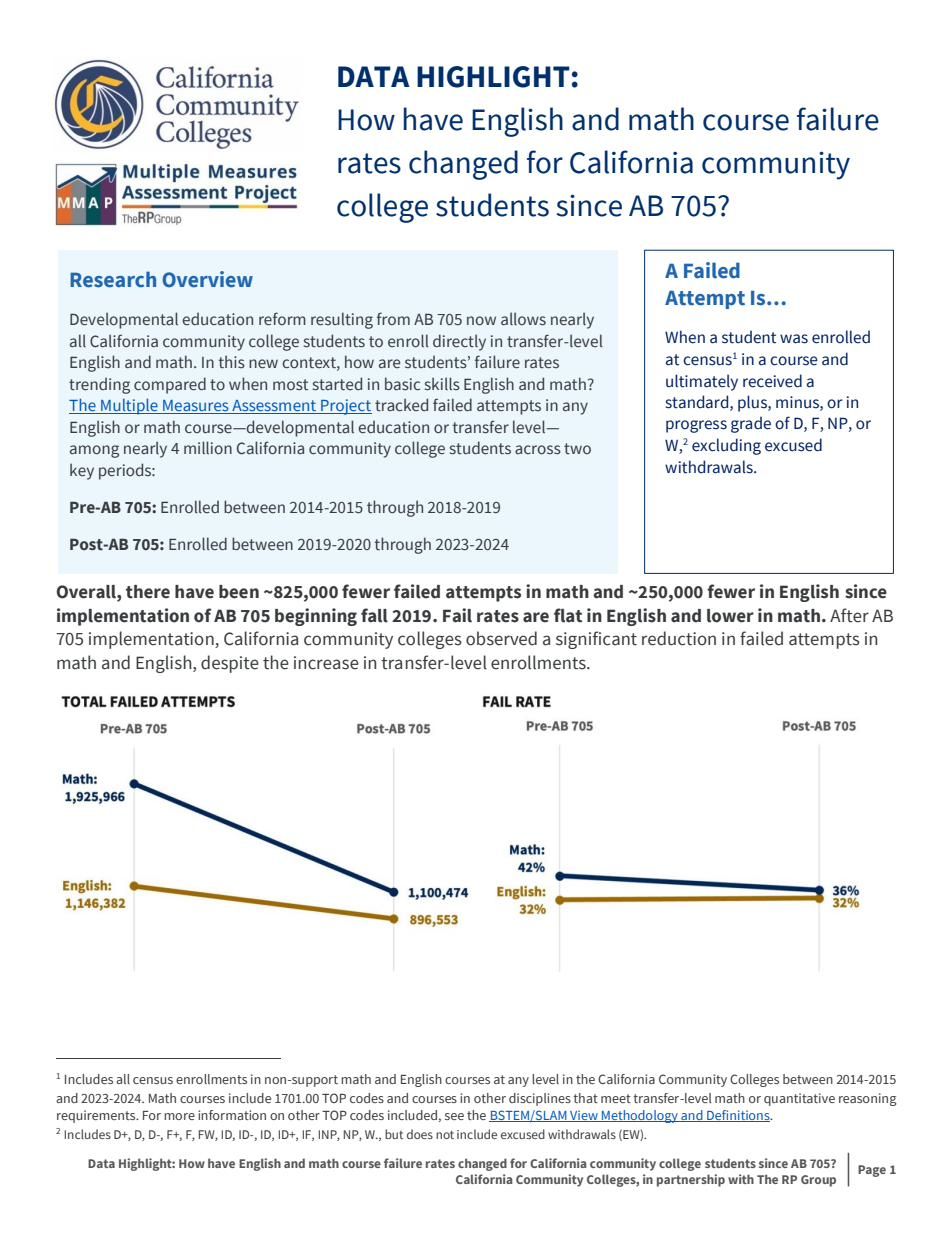
One-term transfer-level math completion, before vs. after eliminating standardized placement testing across California community colleges (2017).
rpgroup.org →"Calculus with Support" (corequisite, no separate prep sequence) pass rate vs. 30% completion for same-prep-level students via the traditional precalculus route. A 2024 state validation review had found that traditional route did not meet AB 1705 standards.
collegecampaign.org →
3-year graduation rate, ASAP participants vs. matched comparison, RCT-verified by MDRC. A different lever than the other three: comprehensive advising and financial support, not placement reform. Same result, closing outcome gaps without more testing.
mdrc.org →"It's high-expectations plus structured peer support. The SAT would have screened [that student] out. It would have been wrong."
— Uri Treisman